
Xperi’s DTS AutoStage: Major Advancement In AM/FM Radio Ratings With Daily In-Car Audience Measurement From 6 Million Vehicles
Click here to view a 14-minute video of the key findings.
Click here to download a PDF of the slides.
Xperi’s DTS AutoStage is now reporting in-car AM/FM radio audiences in over 300 local U.S. markets from 6 million vehicles. In a first for the radio industry, the new data includes overnight ratings in all 300 markets.
Key takeaways:
- AM/FM radio’s “big data” moment has arrived with massive sample sizes that grow each month: TV has long had cable set top data and smart TV data to generate large samples of tuning data. It’s now radio’s turn! Just like cable set top data, there are no demographics but all markets have large samples. Overall, sample sizes are 5-10X bigger than current ratings samples.
- Overnight ratings in over 300 markets: In an industry first, every market now has audience shares from yesterday. See your station’s daily audience trends refreshed each day.
- All listening occurs with humans present: 25% of TV viewing occurs to an empty room but AM/FM radio listening in traveling vehicles always has humans present!
- Large samples mean stable listening trends: In all sized markets and for all sized stations, daily share trends are stable and consistent.
- AM/FM radio now has modern, cutting edge, timely measurement, which does not rely on a consumer’s memory or require a consumer to do something (like wear a gizmo).
In-car AM/FM radio listening represents the largest exposure to Americans
Edison’s “Share of Ear” report reveals AM/FM radio has a stunning 85% share of in-car ad-supported time spent.
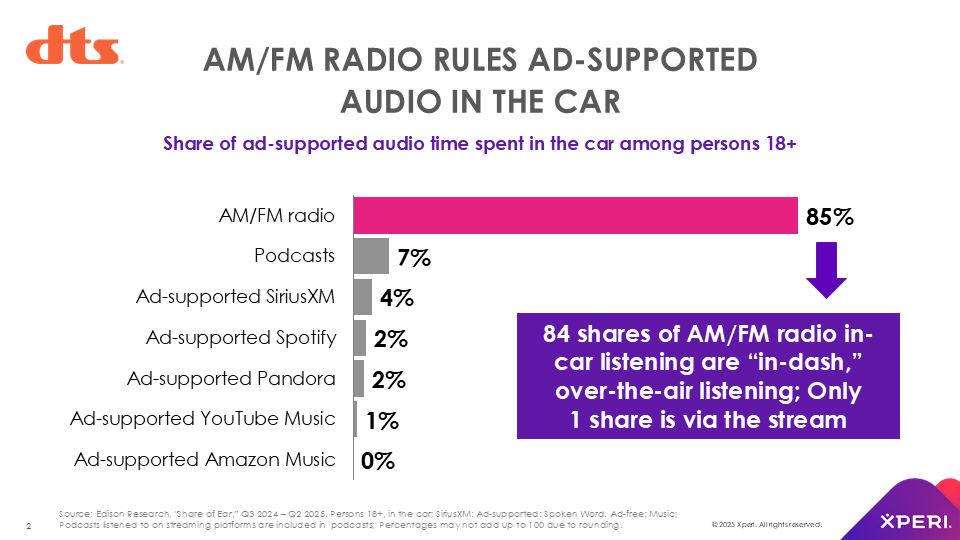
Virtually all in-car AM/FM radio listening occurs over-the-air via the radio in the vehicle dashboard. Only a tiny amount (one share) of AM/FM radio’s 85% in-car shares occurs via the stream. Most AM/FM radio streaming occurs at home, followed by the workplace.
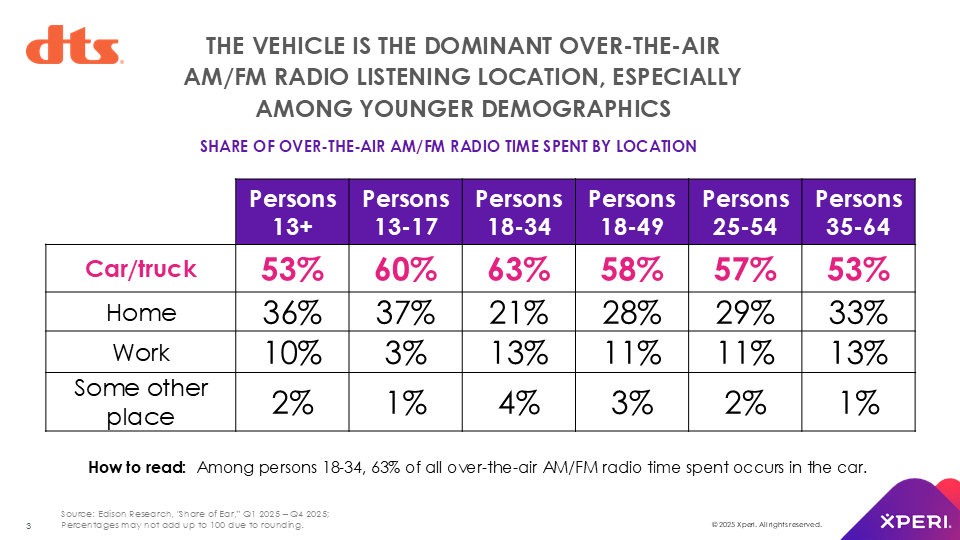
The younger the demo, the greater AM/FM radio’s in-car audiences
Edison’s “Share of Ear” study reveals among 13-34s, in-car listening represents over 60% of all time spent with U.S. AM/FM radio. Among 25-54s, in-vehicle listening generates 57% of all time spent with American AM/FM radio.
In-car listening is massive among women
72% of all AM/FM radio listening among women 18-34 occurs in-car. Two-thirds of all 25-54 female AM/FM radio listening occurs in the car, according to Edison’s “Share of Ear” study.
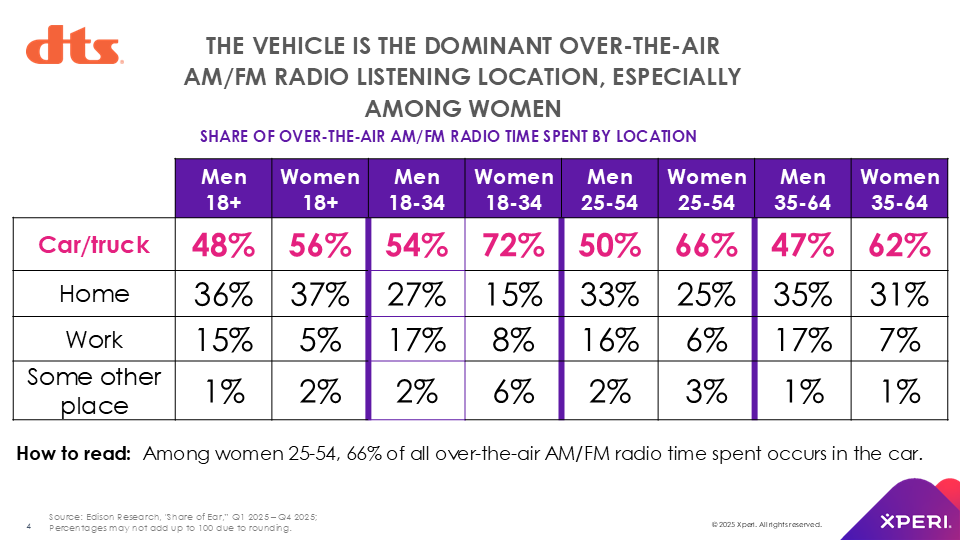
To reach younger demographics and women, all roads lead to AM/FM radio listening in the car.
There are three things radio stations need to provide to show up in Xperi’s DTS AutoStage audience rankings: Most important? Providing DTS with “now playing” metadata from your station playout system
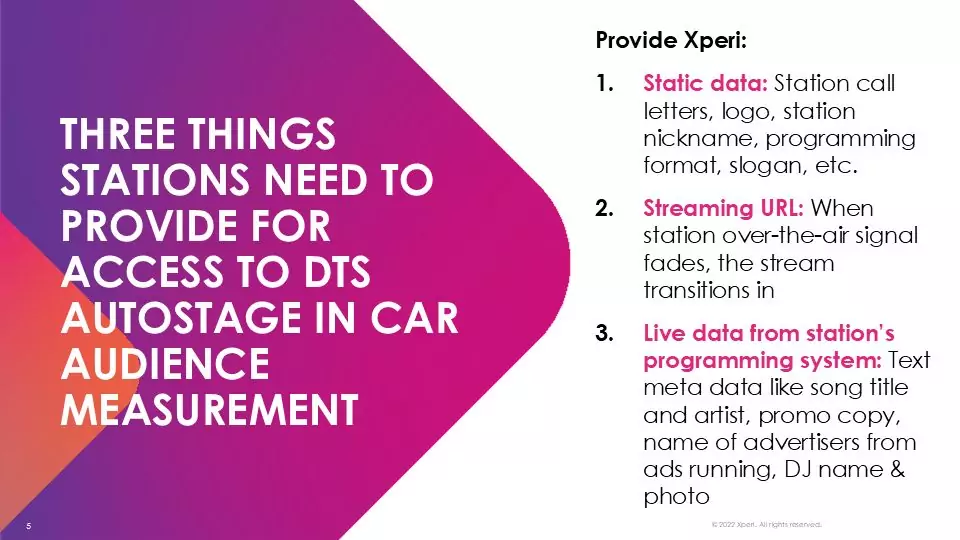
Providing DTS with the “now playing” live data from your station’s programming system is crucial. Without that data feed, your station audiences are much smaller in the DTS AutoStage ratings.
A recent example is from Buffalo, New York, where two Townsquare stations typically generate a 20% combined share of listening.
Before they started providing DTS their “now playing” metadata, each Townsquare station only had a 0.5 share in DTS. Once the “now playing” metadata started flowing to DTS, the two stations’ shares soared to a combined 25 share.
A yellow dot next to call letters on ranker means the station is not providing DTS AutoStage with the vital “now playing” metadata
How do you know if a radio station’s poor performance in DTS AutoStage is due to not providing DTS with “now playing” metadata? Look for the yellow dot, which means “live data not provided.”
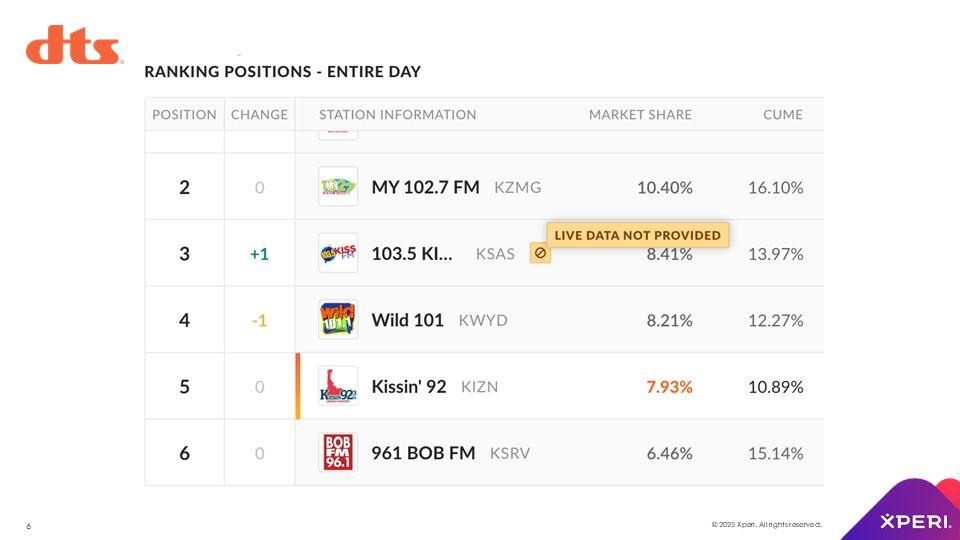
That yellow dot indicates a station is not providing DTS with the crucial “now playing” metadata. Typically, audience shares are a fraction of what they should be when a station does not provide the “now playing” metadata feed to DTS.
DTS AutoStage audience metrics will be familiar to agencies and broadcasters
- Time spent listening: The average number of tuning minutes per vehicle turned to an AM/FM radio station. 30 seconds is the minimum listening needed to generate a minute of audience credit.
- Share: A station’s total minutes listened divided by total minutes spent by all vehicles to AM/FM radio in a market.
- Cume: The % of vehicles that listened at least once to a station.
DTS AutoStage AM/FM radio listening audiences come from a diverse array of auto manufacturers, which makes the data representative

The ten auto manufacturers providing data represent European brands, EVs, domestic, and Asian brands.
DTS AutoStage AM/FM radio listening samples sizes are massive
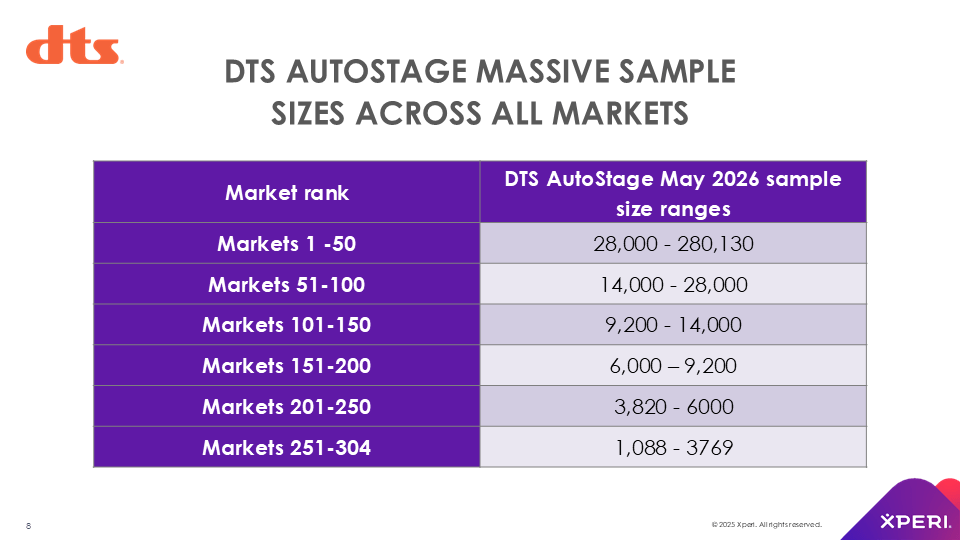
The smallest DTS AutoStage market has a monthly sample size of over 1,000 vehicles.
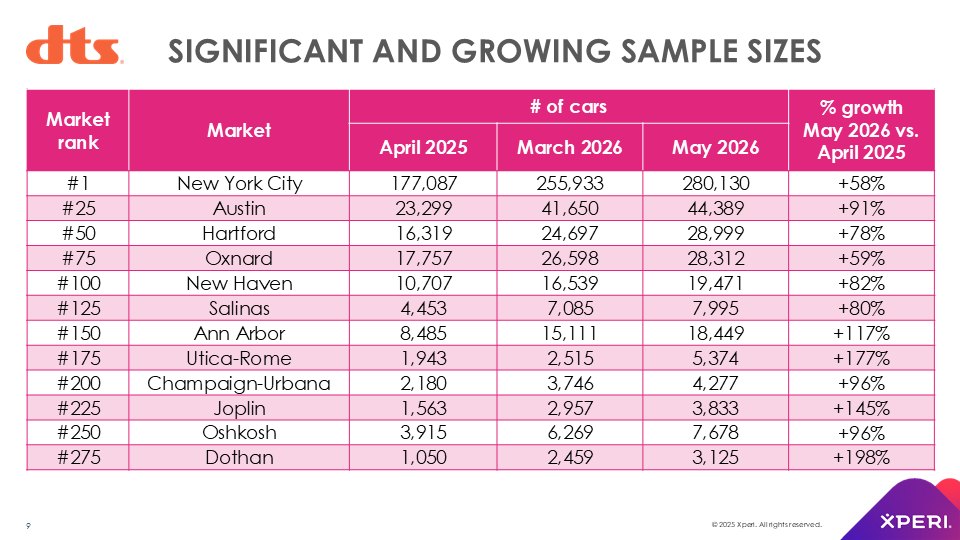
DTS sample sizes are constantly growing; In-tabs are up ~2X over the past year
This sampling of DTS AutoStage markets reveals vehicular in-tabs are surging. Over the last year, the average DTS market has seen its sample nearly double. The smaller the market, the greater the sample size growth.
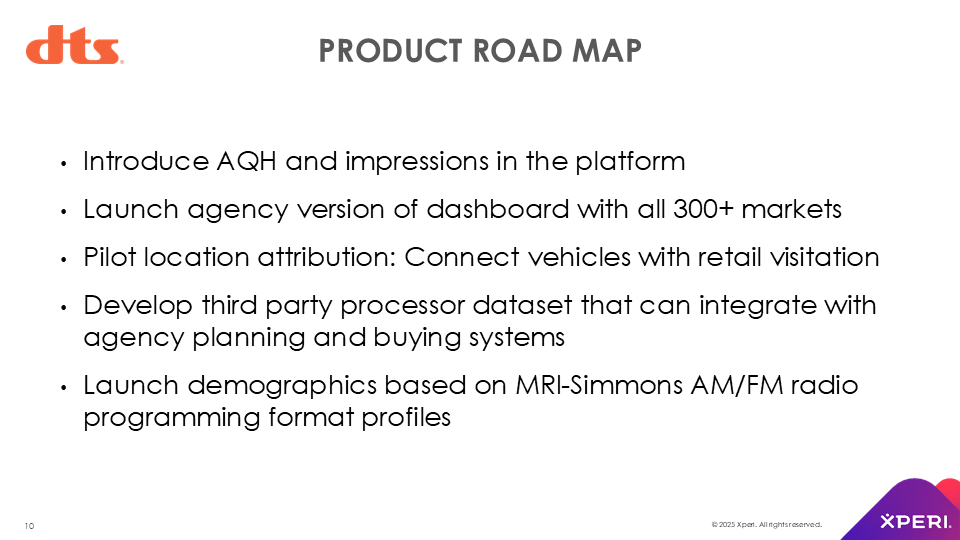
Future DTS AutoStage enhancements and new functionality
DTS AutoStage shows all station audiences whether they subscribe or not
Over the last several years, large amounts of AM/FM radio listening has gone missing due to Nielsen Audio’s new “pay for play” policy. By only reporting audiences from stations that “pay to play,” upwards of 10%, 20%, and even 40% of listening shares are missing.
Agencies and advertisers reject Nielsen Audio’s “pay to play” approach
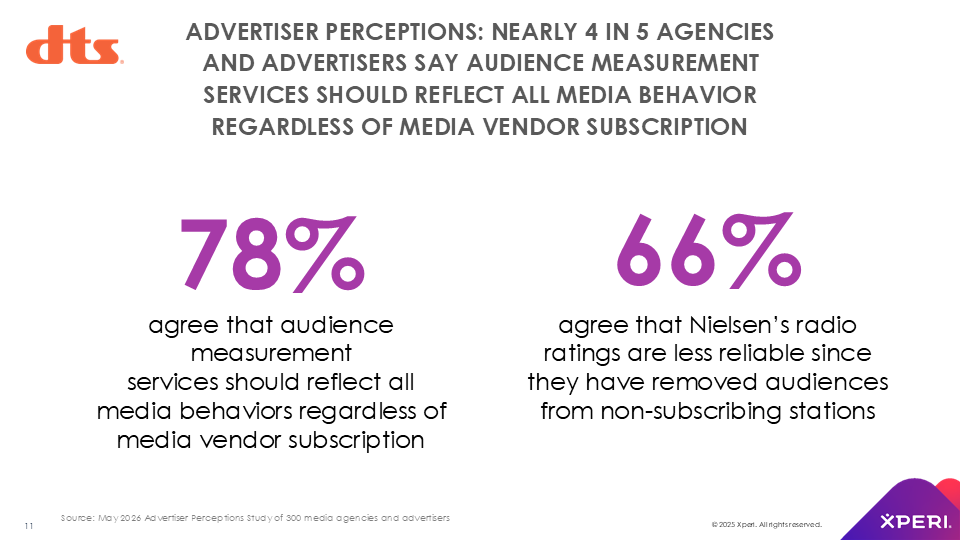
A May 2026 Advertiser Perceptions study of 300 media agencies and advertisers reveals:
- 78% say audience measurement services should reflect all media behaviors regardless of media vendor subscription
- 66% agree that Nielsen’s radio ratings are less reliable since they have removed audiences from non-subscribing stations
Fortunately, agencies and advertisers have options. Both Eastlan and Xperi’s DTS AutoStage report listening to all AM/FM radio stations, providing a complete understanding of a market.
A tour of the DTS AutoStage dashboard
There are three profiles your DTS account can be set to: editor, administrator, or ‘view only.’
Editor is the person who can update or change the key metadata associated to your radio stations (format, station nickname, call letters, etc.). Usually, this role is assigned to a General Manager or Program Director. Changes made to the station profile can show up in the car dashboard within ten minutes.
The admin profile can invite other members of your station group into the dashboard as well as edit station metadata. ‘View only’ allows you to see the data but not edit station metadata. You also cannot invite coworkers to the platform.
First view: Market page
This depicts all the markets your owned radio stations appear in. There will be adjacent markets that your owned stations appear in.
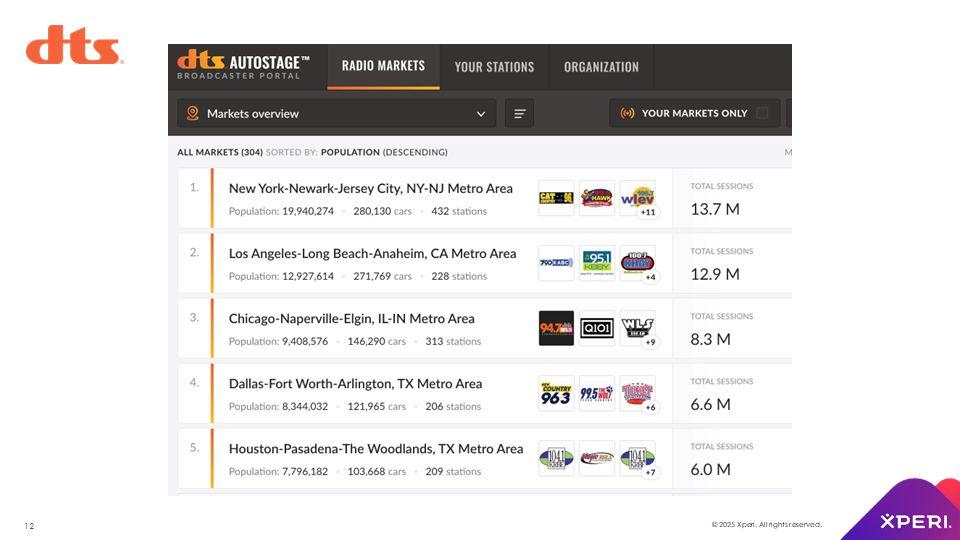
Click on a market to have a ranker appear
Here’s the ranker for Atlanta with station share, cume %, and average time spent listening.
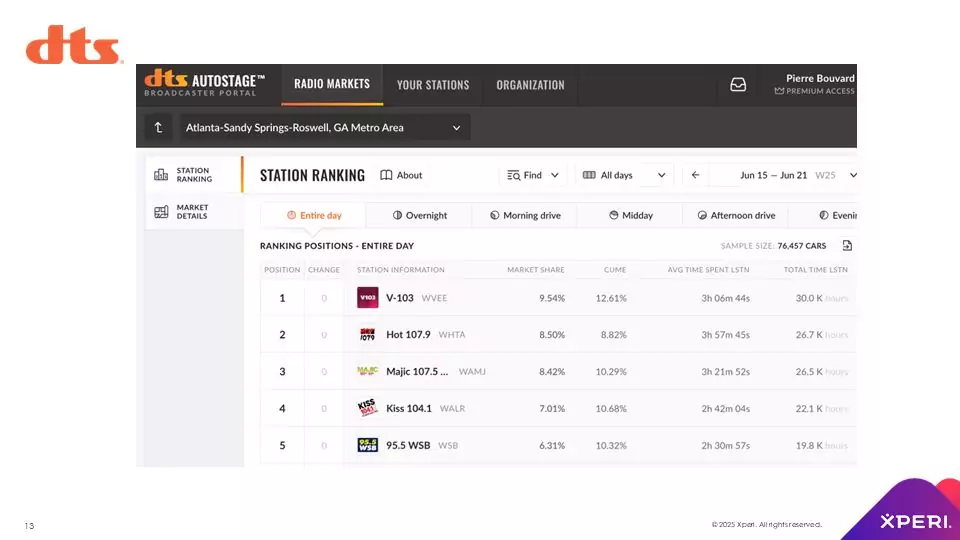
Across the top you can select daypart and days of the week (Monday-Sunday, Monday-Friday, or Saturday/Sunday).
Click your owned station call letters to bring up the station menu
Your owned stations are highlighted in orange. Click on one of your stations and you’ll be taken to daily audience trends and a menu of station analysis options.
Here we see the daily shares for the most recent 30 days of Cat Country WCTO in Allentown-Bethlehem. Notice how stable the shares are!
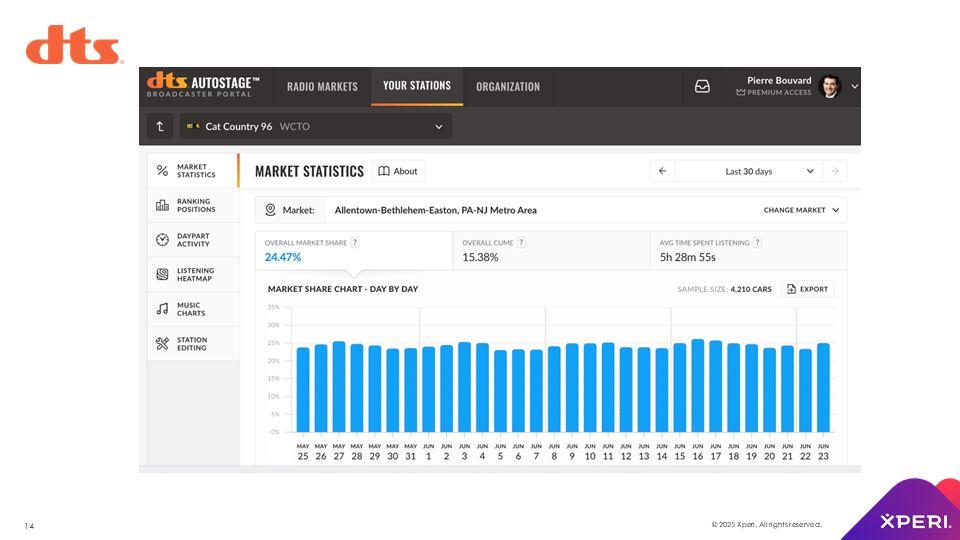
On the left, here are the menu options to analyze one of your stations:
- Market statistics: Daily or weekly trends for your stations for share, cume, and time spent listening.
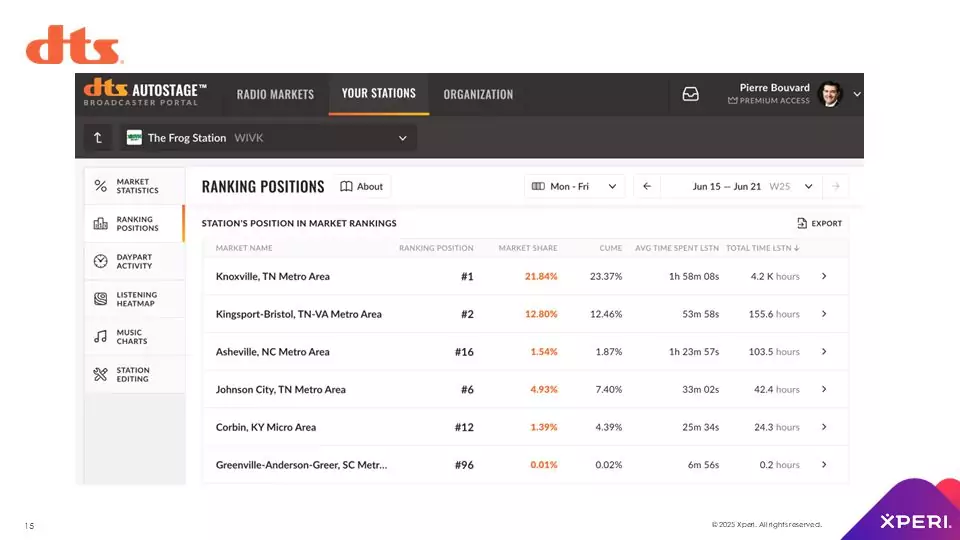
- Ranking positions: This summary report details all the markets your station shows up in. Metrics depicted for your station include share, cume rating, and time spent in each market. Here is the report for WIVK Knoxville.
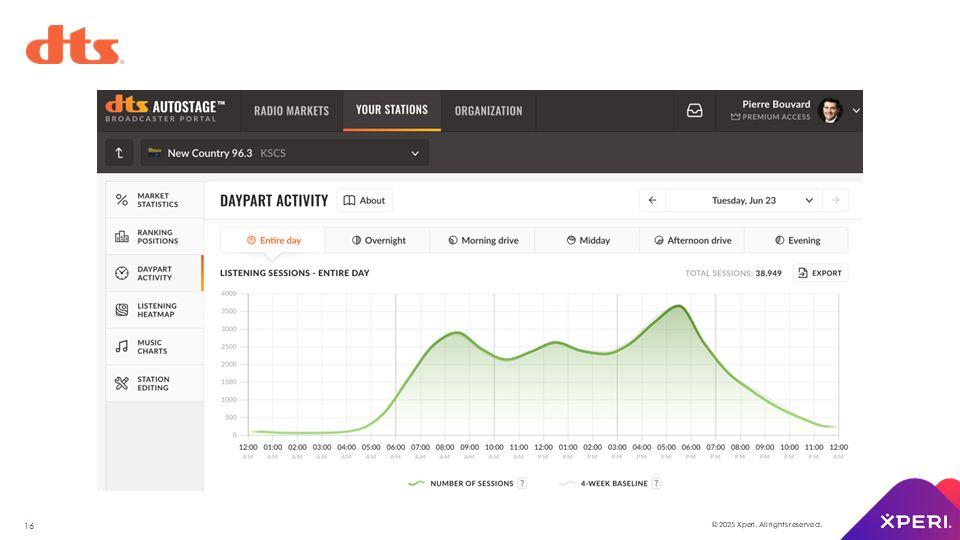
- Daypart activity: This is an hourly or quarter-hour visual depicting listening occasions for your station throughout the day. In the top right you can select which day you would like to see. For this day, we can see KSCS Dallas has consistent tuning throughout the day with peaks at 7AM and 6PM.
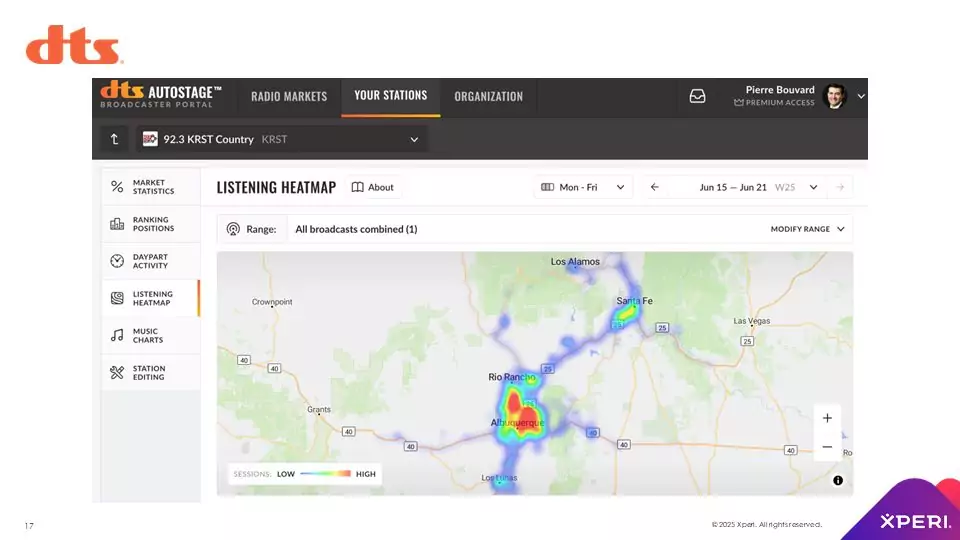
- Listening heatmap: This visual always elicits an “oh wow” from advertisers and agencies. This map depicts the location of your station listening across the market. Colors indicate the intensity of the geographic patterns of your station’s listening audience.
This is a “first ever” chart for AM/FM radio. This is the first time in the history of AM/FM radio that radio listening is visually represented where it actually occurs.
Nielsen zip code reports or listening maps represent all tuning tied back to the home zip code of the respondent. The “tie all listening back to the home zip code” approach is deceiving as 65% of AM/FM radio listening occurs away from home.
Here is a heat map for KRST Albuquerque. You can zoom in on the map to see the names of the towns and villages where the station has audience. You can see listening that occurs on major highways and roads.
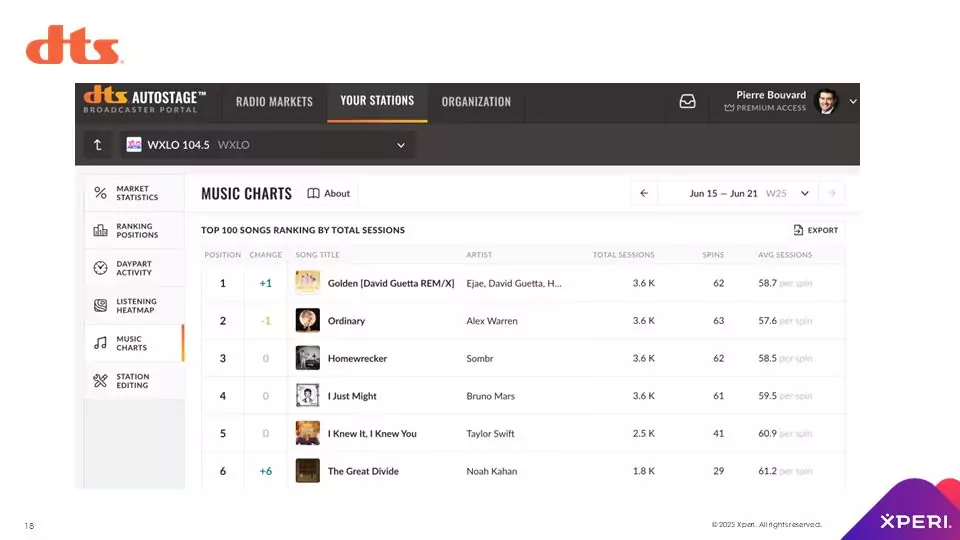
- Music charts: This shows the songs with the greatest exposure to your station’s in-car audience. Here are the songs from a recent week on WXLO Boston Worcester with the greatest in-car audience exposure.
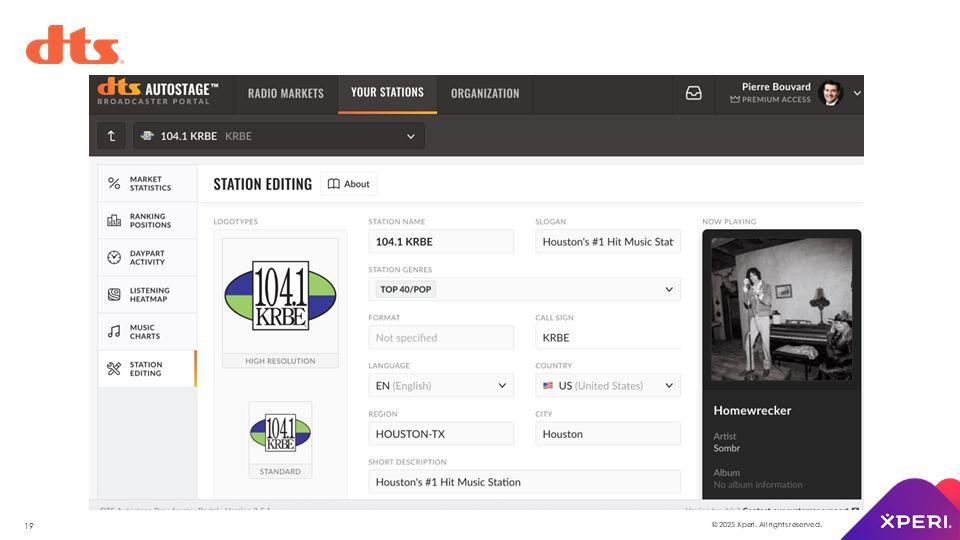
- Station editing: This is where you update the crucial metadata about your stations. There is also a “now playing” visual that shows what in-car listeners see at that moment on their vehicle radio dashboard. Here’s a look at KRBE Houston.
Key takeaways:
- AM/FM radio’s “big data” moment has arrived with massive sample sizes that grow each month: TV has long had cable set top data and smart TV data to generate large samples of tuning data. It’s now radio’s turn! Just like cable set top data, there are no demographics but all markets have large samples. Overall, sample sizes are 5-10X bigger than current ratings samples.
- Overnight ratings in over 300 markets: In an industry first, every market now has audience shares from yesterday. See your station’s daily audience trends refreshed each day.
- All listening occurs with humans present: 25% of TV viewing occurs to an empty room but AM/FM radio listening in traveling vehicles always has humans present!
- Large samples mean stable listening trends: In all sized markets and for all sized stations, daily share trends are stable and consistent.
- AM/FM radio now has modern, cutting edge, timely measurement, which does not rely on a consumer’s memory or require a consumer to do something (like wear a gizmo).
Click here to view a 14-minute video of the key findings.
Pierre Bouvard is Chief Insights Officer of the Cumulus Media | Westwood One Audio Active Group®.
Contact the Insights team at CorpMarketing@westwoodone.com.